

Ask a room of social media managers which Instagram format performs best and you’ll get three confident answers. Reels win reach. Carousels win saves. Single images are dead. All three are said with the same certainty, and the data only supports two of them.
Instagram’s format hierarchy has genuinely shifted. The change isn’t dramatic – the best and worst formats are still within about a fifth of a percentage point of each other on engagement – but the direction matters, because it decides what you spend the next month making.
This is a decision guide, not a definitions post. It covers what the 2026 data says, why reach and engagement disagree about the ranking, what each format is actually for, and how to set a mix you can defend.
Key Takeaways
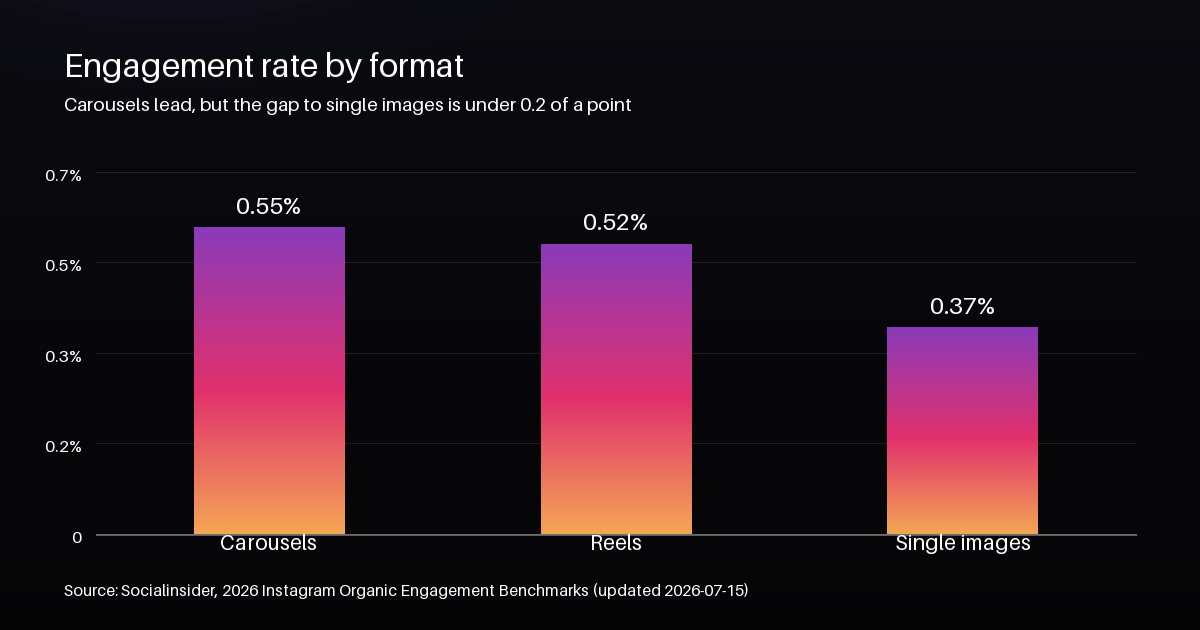
- Carousels lead on engagement at 0.55%, ahead of Reels at 0.52% and single images at 0.37%.
- On reach the three formats are almost level: carousels 3.32%, images 3.30%, Reels 3.15%. Format choice moves execution, not destiny.
- Carousels generate the most saves across every brand size, which makes them the loyalty format rather than the discovery one.
- Reels are now table stakes – posting volume is up 33% year over year without a matching engagement gain, so more Reels isn’t automatically more growth.
What the 2026 data actually says
Start with engagement rate, because it’s the number everyone argues about. Socialinsider’s latest dataset puts carousel posts at 0.55%, Reels at 0.52% and single images at 0.37%.
Engagement rate is total interactions divided by the audience base, expressed as a percentage. If you want the four ways that denominator can be defined, and why they disagree, we covered it in the engagement rate guide.
Read those three numbers honestly and the gap is smaller than the debate suggests. Carousels beat images by 0.18 of a percentage point. That’s a real difference over a year of posting, and it’s not a reason to abandon a format that works for your niche.
Why reach tells a different story
Reach rate asks a harder question: of everyone the post could have reached, how many saw it? On this measure, Instagram is almost format-neutral.
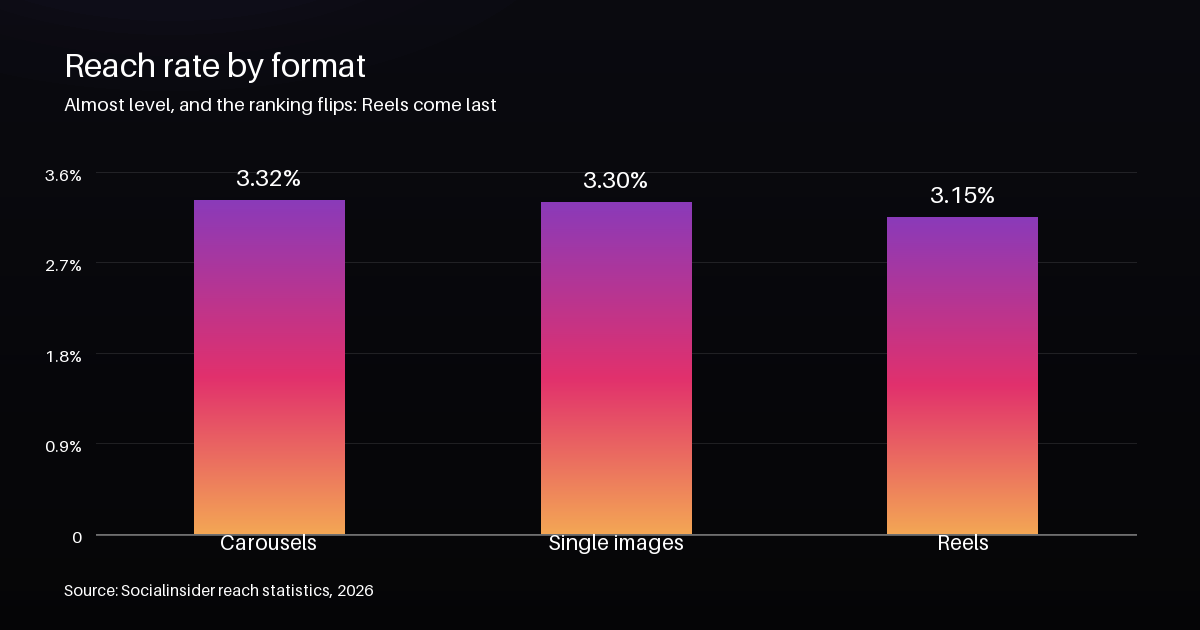
Reach rate is the share of your audience base that a post actually appeared to. The spread here is 0.17 of a percentage point across all three formats – narrower than the engagement spread, and it points a different way. Reels, the format most people assume owns reach, comes last.
That doesn’t mean Reels fail. It means Reels no longer guarantee distribution the way they did when Instagram was pushing the format hardest. Socialinsider’s own summary of 2025 puts it plainly: Reels have become table stakes, offering stable performance but no longer guaranteeing incremental gains – and brands responded by increasing Reel volume by 33% year over year.
The pattern worth noticing is what happens when a format’s supply rises faster than its return. More Reels, the same engagement, and a slightly lower reach rate. Volume stopped being a lever.
What each format is actually for
The ranking is less useful than the job each format does. Instagram’s own behavior points at three distinct roles.
Carousels: depth, saves and authority
Carousels drive the most saves and the most views across every brand size in Socialinsider’s data. Saves are the strongest signal of stored value, which makes carousels the format for teaching something, walking through a process, or making an argument in layers. They’re also the format most likely to be revisited, because Instagram can resurface any single slide on its own – which is why every slide needs to stand alone without the ones around it.
Reels: discovery and reaching non-followers
Reels remain the format built for people who don’t follow you yet, and Buffer’s 2026 breakdown of the algorithm is specific about the signal that carries them: sends through direct messages are the most heavily weighted signal for reel distribution. That is a sharp constraint disguised as a tip. A Reel that nobody wants to send to a friend is a Reel the algorithm has little reason to push, so the goal isn’t watch time alone – it’s sendability.
Single images: the grid and the culture layer
Single images are the weakest format on engagement and the only one whose posting volume is falling, down from an average of ten posts a month in 2024 to seven in 2025. They have not stopped working. They have stopped working as a growth engine, and become the layer that keeps a grid coherent, humanises the account and carries announcements.
Why cost changes the answer
The numbers describe the return. The cost side decides whether the return is worth it, and the three formats don’t cost the same to produce.
- A carousel costs design time per slide. Ten slides means ten decisions, and one weak frame drags the whole post. This is the most expensive format to do well and the cheapest to do badly.
- A Reel costs iteration. The edit is rarely the hard part. Finding a hook that survives the first two seconds, and a reason for someone to send it on, is where the hours go.
- A single image costs almost nothing. That is its advantage, and the reason it is so often over-used: low cost hides low return.
The practical rule is to spend format effort where it compounds. Carousels and Reels both compound – one in stored value, one in distribution. Single images don’t, which is why a defensible grid is mostly the other two.
How to set your mix
Socialinsider’s 2026 recommendation is a starting point, not a target: roughly 60% to 70% Reels, 20% to 30% carousels, and about 10% single images or culture posts, with Stories running frequently alongside as the relationship layer.
Use it as your first month and then let your own data override it. Three adjustments in order of usefulness:
- Find your one format that overperforms. Run a free analysis on your own profile and compare engagement rate and reach rate by format. Almost every account has one format that beats its average, and the mix should lean into it.
- Move budget from images to carousels before adding Reels. The cheapest upgrade on this list is converting the images you’re posting out of habit into carousels. Same topic, same research, better return.
- Stop adding Reels volume when reach per Reel is flat. If a Reel’s reach rate isn’t improving as you post more of them, you are paying production cost for no distribution.
And once the mix is right, the count is the next lever – read how often to post next, because the answer changes with the mix.
If you’re comparing your mix against someone else’s, read our guide to analyzing a competitor’s account first – format mix is one of the few things you can measure honestly on another profile.
Four mistakes with format strategy
1. Chasing the leaderboard instead of the job
If carousels lead on engagement, the answer isn’t “post only carousels”. Carousels will not introduce you to people who don’t follow you, which is what Reels do. Pick the format for the job and use the numbers to check you’re doing it well.
2. Comparing formats across your whole history
A format comparison only means something inside one window. If your carousels are recent and your images are from two years ago, you are comparing your current work to your old work and calling it a format result.
3. Judging Reels on likes
Reels are the format where the most valuable action – a send – leaves no public trace. Judging them on likes alone will make you think they’re underperforming when they’re doing their actual job.
4. Ignoring saves entirely
Saves are the action that predicts whether a piece of content keeps working weeks later. If your reporting counts likes and comments and stops there, you’re blind to the metric carousels win on.
Frequently asked questions
Are Reels still worth making in 2026?
Yes, but not as a volume play. They remain the format designed to reach people who don’t follow you, and that job does not have a substitute. The change is that posting more of them no longer produces more distribution on its own.
Do carousels really get more reach than Reels?
In the latest data, slightly – 3.32% against 3.15% reach rate. It’s a narrow gap, and it’s model-dependent, so treat it as a tie broken by effort rather than a decisive win.
How many slides should a carousel have?
Enough to make the argument, no more. Because Instagram can resurface any slide individually, the constraint isn’t length – it’s that every slide has to work alone. Cut any frame that only makes sense next to the one before it.
Should I stop posting single images?
No – just stop expecting them to grow the account. They’re the cheapest format, and the grid and the culture layer still need them. What they shouldn’t do is fill most of your calendar.
How do I know which format works for my account?
Compare engagement rate and reach rate by format on your own last twenty to thirty posts. A free analysis on any public profile returns both, alongside the top posts breakdown – which is where you will see which format your outliers share. Here’s exactly what each analysis step returns.
The short version
Carousels lead on engagement and saves, Reels still own discovery, single images hold the grid together. The gaps between them are small enough that the mix – not the winner – is the real decision, and the fastest upgrade available to most accounts is converting habit images into carousels.
Run a free analysis on your own profile and read your engagement and reach rates by format before you set next month’s calendar.