

Most competitor research on Instagram starts with the wrong question. People ask “what are they posting?” when the useful question is “what is working for them, and does it work better than what we do?”
That question has an answer you can reach from outside a profile – but only partly. Instagram keeps its most valuable numbers behind the account owner’s login. Reach, impressions, saves and audience demographics are invisible to everyone else. What stays visible is still enough to make a decision, if you extract the right numbers and stop looking for the ones that are not there.
This guide starts with that boundary, because getting it wrong is the fastest way to build a competitor report out of nothing. Then it covers the five numbers worth extracting and a thirty-minute workflow you can repeat every month.
Key Takeaways
- Saves, reach and impressions are private. An outside-in analysis can only produce a followers-based engagement rate – anything else is an estimate.
- Five numbers carry almost all the signal: engagement rate, average engagement per post, posting rhythm, content mix, and the top three posts.
- Compare within an account size class and against the platform’s direction of travel, not against a fixed target.
- The most copyable finding is rarely the format. It’s usually the recurring theme underneath the top posts.
What you can and cannot see from outside a profile
Start with the honest inventory, because the limits shape the whole method. Private accounts are out entirely – Instagram only exposes performance data for public profiles. For a public profile, the split looks like this.
Visible to anyone, without a login:
- Follower count.
- Likes and comments on every public post.
- Captions, hashtags, tagged accounts and location tags.
- Post dates and times, which makes posting rhythm fully reconstructable.
- View counts on reels and videos, where the account has not hidden them.
- Bio, link, highlights, and the order of the grid.
Invisible unless you own the account:
- Reach and impressions.
- Saves and shares on individual posts.
- Profile visits, link taps and follower demographics.
- Story metrics, including replies and exits.
- Watch time and retention on reels.
That second list sets the ceiling on what any outside analysis can claim. If reach is private, then any reach-based engagement rate attributed to a competitor has to be estimated, whether or not the tool admits it. The only rate you can compute honestly for someone else’s profile uses the follower count as its denominator.
The five numbers worth extracting
You can collect dozens of data points from a public profile. Five of them carry most of the decision.
- Engagement rate, followers formula. Likes plus comments, divided by followers, times 100. This is the only honest rate available from outside, and it runs systematically lower than the owner’s own figure, because it can’t include saves or shares. We broke the formula and its four variants down in our engagement rate guide.
- Average engagement per post. Total engagement across the audited posts divided by the number of posts. Not a rate – a measure of output. It separates a small audience that loves an account from a large audience that ignores it.
- Posting rhythm. Posts per week, plus the gaps. Rhythm leaks resourcing: daily posting implies a team or a system, while two posts a week with strong engagement implies craft.
- Content mix. The ratio of video, carousel and single image, plus the themes that keep returning. In practice this is the most copyable finding in the whole exercise.
- The top three posts, not the median. Their median describes their habit. Their top three describe their ceiling, and the ceiling is usually where the strategy lives.
Where Instagram engagement went in 2025
You can’t read a competitor’s numbers against a fixed target, because the platform’s own numbers move underneath them. Rival IQ’s industry benchmark report measured engagement falling on every major platform it tracks, and Instagram’s decline was the mildest of the four.
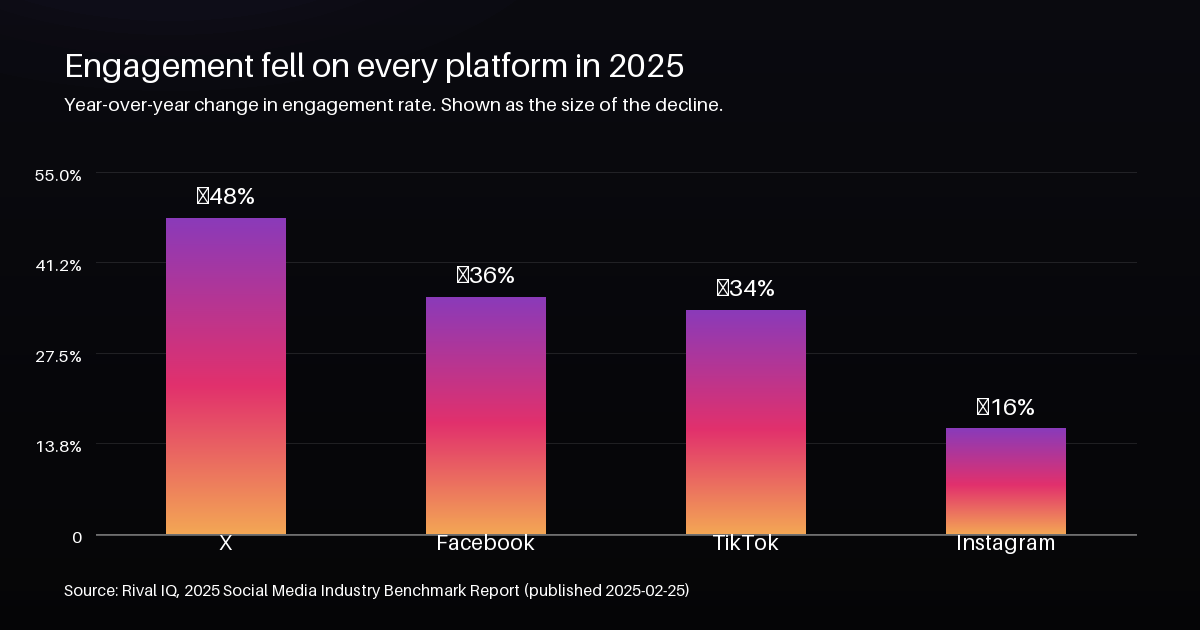
A profile that looks like it’s slipping in 2026 might be performing exactly as the rest of its platform is. A profile that looks flat might be gaining share. Direction of travel matters more than the absolute number.
How to build a comparison that is actually fair
Most competitor reports fail here. Four rules fix that.
Compare within an account size class
Engagement rate falls as follower counts rise, and it’s arithmetic rather than performance. A 2,000-follower account and a 200,000-follower account don’t convert audience into interaction at the same rate, so comparing them tells you about their size, not their skill. Compare your profile to accounts in your own band, and compare a competitor to its own history.
Compare like formats with like formats
A profile posting mostly carousels and a profile posting mostly single images are running different businesses. If the format mix differs by more than about half, split the comparison by format before drawing any conclusion about who is winning.
Use the same window
Thirty days, ninety days, or the last twenty to thirty posts – pick one and hold it. Mixing a competitor’s last six posts with your last thirty compares two different seasons and two different levels of practice.
Read direction, not position
The useful output of a comparison isn’t “they beat us”. It’s “their carousels outperform, their rhythm is tightening, and their recurring theme is X” – statements you can act on this week.
What the numbers cannot tell you
An outside-in analysis produces arithmetic, not causes. Four things sit permanently outside its reach.
- Why a post went viral. Often it’s the audio, the timing or a reshare from a larger account. None of that’s visible in the data.
- Whether any of it was paid. Promoted posts look like organic coverage from outside. A spike that came from ad spend will mislead you into copying content that had help.
- What their goals are. An account optimizing for saves and an account optimising for reach will look identical on the surface and be running opposite strategies.
- Whether their best post was repeatable. One outlier is one data point. A pattern across five posts is something you can learn from.
The thirty-minute workflow
This is the part that turns the method into a routine.
- Pick three to five accounts (5 minutes). Two direct competitors, one account one size class above you, and one from an adjacent niche you admire. More than five and you stop reading the data carefully.
- Run each public profile through an analysis (8 minutes). The free preview on our analyzer returns follower count, engagement rate, average engagement, posting rhythm, content mix, comments history and the top posts breakdown with real likes and comments, without an account and without a login.
- Put the five numbers in one grid (7 minutes). One row per account, five columns. Resist adding a sixth column.
- Read their top three posts properly (8 minutes). Open each one. Read the caption, note the format, note the angle. This is where the copyable idea usually is.
- Write three moves (2 minutes). Not a report – three specific changes you’ll test this month, each traceable to one row of the grid.
Two follow-ups that use the same data: which format is driving their engagement rate, and whether their posting rhythm is actually paying off.
If you want the deeper version of any single account, the free preview is the starting point and the full AI growth report is the paid one: positioning read from the data, content strategy, virality patterns, engagement and community insights, opportunities and gaps, five to seven practical moves and three original content ideas for that niche, plus an audit of any individual post you open.
One promise worth testing on a competitor rather than on yourself: when a metric isn’t publicly available, it’s labeled unavailable instead of estimated. Check that against a profile that hides its engagement and see what comes back.
Frequently asked questions
Can I see another account’s engagement rate without a paid tool?
Yes. Likes, comments and follower count are public, so the followers-based rate is arithmetic you can do by hand. What you can’t include is saves and shares, which are private – so the number you’ll get is lower than the one the owner sees.
Can I see a competitor’s reach or impressions?
No. Reach and impressions sit behind the account owner’s login and aren’t exposed publicly at all. Anyone reporting a competitor’s reach is estimating it.
How many competitor accounts should I track?
Three to five. Enough to see a pattern, few enough that you still read the individual posts instead of only the numbers.
Why is a competitor’s engagement rate higher than mine?
Most often it’s account size, format mix and niche narrowness – in that order. Check the size class first, then look at whether they lean on carousels or reels, then ask how tightly they have defined their audience. A higher rate isn’t automatically better performance.
Can I tell which of their posts were promoted?
Not from public data. Paid posts look like organic coverage from outside, so treat any single spike as unreliable until the pattern repeats without help.
Is analyzing a public profile allowed?
Yes. Everything described here uses data the account has already published to the public. Private accounts can’t be analyzed, and any tool asking for Instagram credentials should be refused.
The short version
Accept the boundary: no reach, no impressions, no saves from outside – so one honest rate and four supporting numbers. Compare within a size class, inside one window, against the platform’s direction rather than a fixed target. Then read three of their best posts properly, because that’s where the idea you can actually use will be.
The whole thing takes about half an hour, and the free preview covers the data collection for you.