

Ask ten marketers what a good Instagram engagement rate looks like and you’ll get ten different numbers. Ask how they calculated it and you’ll get a different story again.
That’s the problem with engagement rate. It’s the most quoted metric in social media and the least agreed upon. Two people can analyze the same profile on the same morning and land on 0.8% and 4.0% – both technically correct, both measuring something different.
This guide fixes that. You’ll get the formula, the four variants behind those conflicting numbers, what the 2026 benchmarks actually measure, and how to find the only number that matters for your account: your own baseline.
Key Takeaways
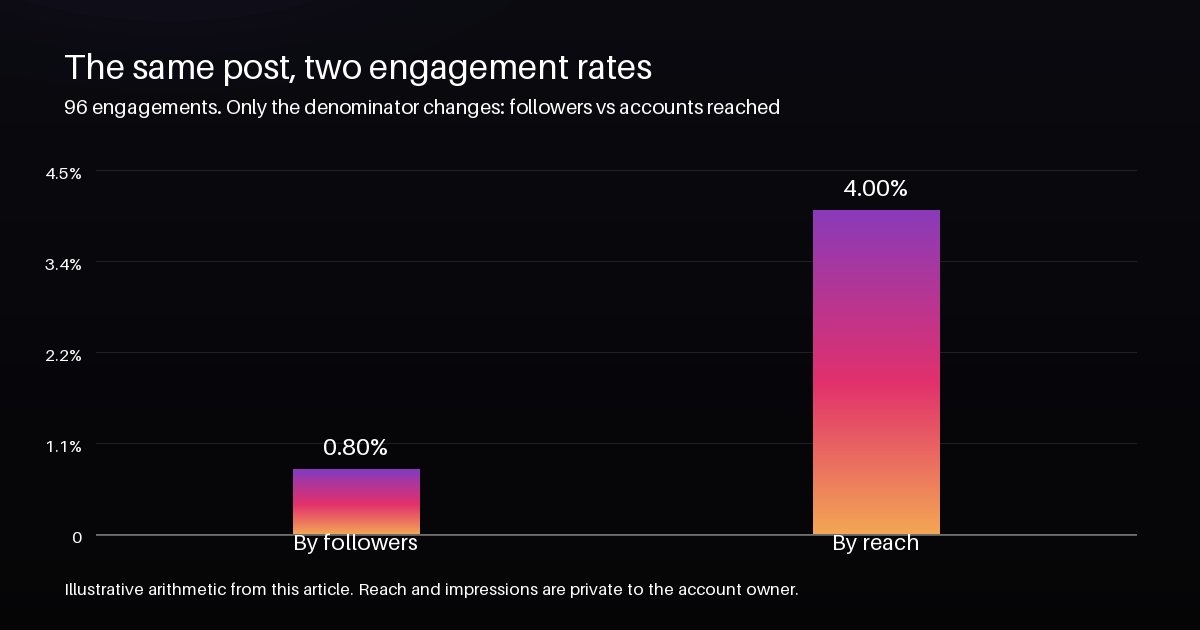
- Engagement rate is a ratio, and the denominator decides the number. The same post scores 0.80% by followers and 4.00% by reach.
- Count likes, comments, saves and shares. Likes on their own understate a strong post.
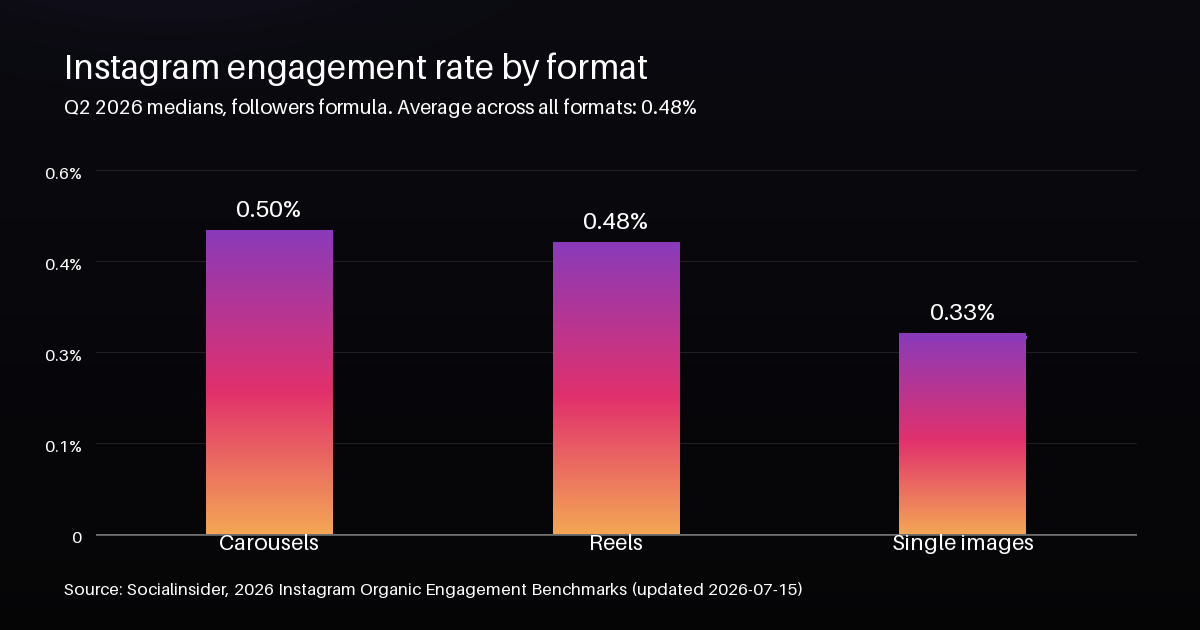
- Socialinsider’s 2026 benchmarks put the average Instagram engagement rate at roughly 0.48%, with carousels strongest at 0.50-0.55% and single images weakest at 0.33-0.37%. Those are medians across brand accounts, not targets.
- Your real benchmark is your own last 20 to 30 posts. Read the trend and the format mix, not one post.
What Instagram engagement rate actually measures
Engagement rate is a ratio, not a count. It answers one question: out of everyone attached to this account, what share did more than scroll past?
Instagram gives you four actions that count:
- Likes – the cheapest signal, and the easiest to give away.
- Comments – effort. A comment costs the reader something.
- Saves – intent. Someone decided this was worth coming back to.
- Shares – distribution. Someone put your post in front of their own audience.
Reach and impressions aren’t actions. They’re the denominator – the audience you’re measuring against.
Instagram’s ranking does not treat the four equally either. Buffer’s 2026 breakdown of the Instagram algorithm states it plainly for reels: sends through direct messages are the most heavily weighted signal for distribution (Buffer, 2026). That is a share, not a like.
Likes are the cheapest of the four, which is exactly why they tell you the least on their own. Comments, saves and shares cost the reader more, so they carry more information. A post with 200 likes and 2 saves is a different post from one with 120 likes and 40 saves, even if the first one looks bigger in the feed.
How to calculate engagement rate
The standard formula, and the one most tools quietly use:
Engagement rate = (likes + comments + saves + shares) ÷ followers × 100
Here is that formula on a single post – an illustrative example, not a real profile:
- Followers: 12,000.
- Post performance: 62 likes, 9 comments, 18 saves, 7 shares.
- Total engagement: 96.
- Engagement rate: 96 ÷ 12,000 × 100 = 0.80%.
Now run the same post against reach instead of followers. Suppose it was seen by 2,400 accounts:
- Engagement rate by reach: 96 ÷ 2,400 × 100 = 4.00%.
Same post. Same 96 people engaging. One number says 0.80% and the other says 4.00% – a fivefold difference created entirely by the denominator. That single fact explains most engagement rate arguments you’ve ever had.
The four formulas behind the conflicting numbers
When two sources disagree, they are almost always using a different formula. These are the four in circulation:
- By followers – total engagement divided by follower count. The oldest and most common definition. It’s stable, comparable across profiles, and slightly unfair to large accounts, because follower count grows faster than engagement does.
- By reach – total engagement divided by accounts reached. The fairest read on content quality, because it ignores how many followers you have accumulated. This is the number Instagram Insights shows you.
- By impressions – total engagement divided by total views. Useful for paid campaigns and confusing everywhere else, because one account can generate several impressions.
- Average engagement per post – total engagement across a set of posts divided by the number of posts. It is a profile-level average, not a post-level rate. This is a profile-level number rather than a post-level one, and it’s the version that shows you a trend instead of a snapshot.
There’s one more thing worth knowing: reach and impressions are private. Only the account owner can see them. So any tool that analyzes a public profile from the outside has to use the followers formula. That isn’t a shortcut – it’s the only formula the public data supports.
What counts as a good engagement rate in 2026
The most cited numbers right now come from Socialinsider’s 2026 Instagram benchmarks, published in February 2026 and updated in July 2026. Their figures:
- Overall Instagram engagement rate: 0.48% on average, down roughly 24% year over year.
- Carousels: 0.50% to 0.55% – the strongest format.
- Reels: 0.48% to 0.52%.
- Single images: 0.33% to 0.37% – the weakest format, and falling.
Account size changes the picture just as much. The same study’s audience growth benchmarks for 2025 show how steeply growth slows as an account gets bigger:
- 1K-5K followers: 22.00% annual audience growth.
- 5K-10K followers: 20.29%.
- 10K-50K followers: 17.20%.
- 50K-100K followers: 13.62%.
- 100K-1M followers: 11.25%.
The direction of travel is not in dispute. Rival IQ’s social media industry benchmark report measured Instagram engagement falling 16% year over year across the brands it tracks (Rival IQ). Falling engagement across a whole platform is a trend, not a verdict on your content.
Two honest caveats before you compare yourself to any of it – the same rules are spelled out on our support page. First, these are medians across brand accounts, and the study uses the followers formula – so it’s not directly comparable to a number pulled from Insights. Second, a median is not a target. Half the accounts measured sit below it.
The useful conclusion is uncomfortable but freeing: 0.48% isn’t your benchmark. Your benchmark is what your own account did over the last 20 to 30 posts. A profile with a 1.2% average that suddenly posts a 2.6% carousel has learned something. A profile sitting exactly on the industry median has learned nothing at all until it knows whether it’s trending up or down.
Three mistakes that make your engagement rate useless
1. Counting likes only
Likes are the easy half of the equation. If a post earns 60 likes but also 20 saves and 10 shares, dropping those two actions cuts the measured number by a third. If your rate ignores saves and shares, you aren’t measuring engagement. You’re measuring applause.
2. Comparing accounts of different sizes
Engagement rate falls as follower counts rise. That isn’t a performance problem, it’s arithmetic: a 2,000-follower account and a 200,000-follower account don’t convert audience into interaction at the same rate. Compare like with like, or compare a profile against its own history.
3. Reading one post instead of a trend
A single post is noise. It might have been posted at the wrong hour, or been held back, or caught a wave. The signal lives in the shape of 20 to 30 posts: the trend line, the mix of formats, and which themes keep reappearing near the top.
There’s a fourth, quieter mistake, and it’s the one that damages trust most: treating a missing metric as a zero. Some profiles hide their engagement, and reel view counts are not public for every account. A tool that reports “0” when the truth is “not available” isn’t giving you data. It’s giving you fiction.
How to get your real engagement rate without a spreadsheet
If it is your own account, Instagram Insights gives you reach-based engagement per post. It’s accurate, and it’s also slow – one post at a time, and useless for anyone else’s profile.
For everything else, you can run a free analysis on any public Instagram profile and get the numbers in a couple of minutes. The free preview is built from real public data and includes:
- Follower count and engagement rate.
- Average engagement per post, plus the engagement trend across the audited posts.
- Posting rhythm and content mix (video versus image).
- Comments history.
- The complete top posts breakdown with real likes and comments.
No account, no login and no payment for that part – the reason we built it that way is worth two minutes if the honesty framing matters to you. If you want the deeper read, the full report is a one-time $9.99 through Stripe and adds:
- Profile positioning, niche and target audience, read from the data.
- Content strategy: formats, recurring themes and posting frequency.
- Virality patterns – why the top posts actually worked.
- Engagement and community insights, including what drives comments.
- Opportunities and gaps, plus 5-7 practical moves you can implement immediately.
- 3 original post concepts built for that niche.
- Real reel view counts and an AI audit of any single post, downloadable as a text file.
One detail worth calling out, because it’s unusual: if a metric isn’t publicly available, it’s labeled unavailable rather than estimated. You can see the full breakdown of what each step returns before you spend anything.
Where to go next, depending on what your rate is telling you. If the rate is holding but your output changed, check your posting frequency. If you want to know which format is doing the work, compare carousels, Reels and single images. And if you are benchmarking against accounts you do not own, this is how to do it honestly.
Frequently asked questions
Is engagement rate the same as reach rate?
No. Reach rate measures how much of your audience a post actually reached. Engagement rate measures how many of those people interacted. A post can have excellent reach and weak engagement, or the reverse.
Why do different tools show a different engagement rate for the same profile?
Three usual reasons: the tool uses a different formula (followers, reach or impressions), a different time window, or a different set of posts. The formula matters most, and it’s usually the one nobody states.
What is a good engagement rate for a small account?
Higher than for a large one, and by a wide margin. Averages published across the whole platform mostly describe bigger accounts, so a 5,000-follower profile sitting below 1% is usually underperforming its own size class rather than meeting the standard.
Does Instagram engagement rate include saves and shares?
It should. Saves and shares are the two actions that best signal intent, and both are visible on public posts, so any analysis that leaves them out is working with a strictly worse dataset.
Can I check the engagement rate of another account?
Yes, if the profile is public. Likes, comments and follower counts are visible, which is enough to calculate a followers-based engagement rate for any public account – a competitor, a creator you follow, or your own.
Should I optimize for engagement rate or growth?
Both, but in that order. Engagement rate tells you whether your content works on the audience you already have. Growth tells you whether the work is compounding. Chasing reach while engagement slides usually means you’re buying attention you can’t hold.
The short version
State your formula, or your number means nothing. Count saves and shares, compare yourself to your own last 20 posts, and ignore any published benchmark that doesn’t tell you which denominator it used.
If you’d rather skip the spreadsheet entirely, analyze any public profile for free and read your real engagement rate – and your real trend – in a couple of minutes.